GR00T N1.6: Task vs Scene Geometry
at the System 2 → System 1 Interface

Robotics Security Division, ETHRC

Abstract

GR00T N1.6 is a hierarchical Vision-Language-Action model with two coupled subsystems: a high-level System 2 (Eagle2 VLM backbone) that processes observations and language instructions, and a low-level System 1 (flow-matching diffusion policy) that generates actions. System 2 passes conditioning tokens to System 1 at each step — a bottleneck through which all semantic and visual information must flow.

We probe these interface tokens during rollouts on four tabletop manipulation tasks in SimplerEnv to ask: does the S2 → S1 conditioning representation organize around task identity or scene identity? We study nvidia/GR00T-N1.6-fractal, a model fine-tuned on the Fractal dataset that generalizes reliably across scene variants (see Experiment 1). If its latent space clusters by task — grouping same-task embeddings from different scenes closer than different-task embeddings from the same scene — the interface encodes what to do rather than where you are.

Architecture & Hook Point

GR00T N1.6 architecture: System 2 (VLM) → S2→S1 interface → System 1 (Diffusion Transformer)

  Hook point — conditioning tokens extracted at the S2 → S1 interface

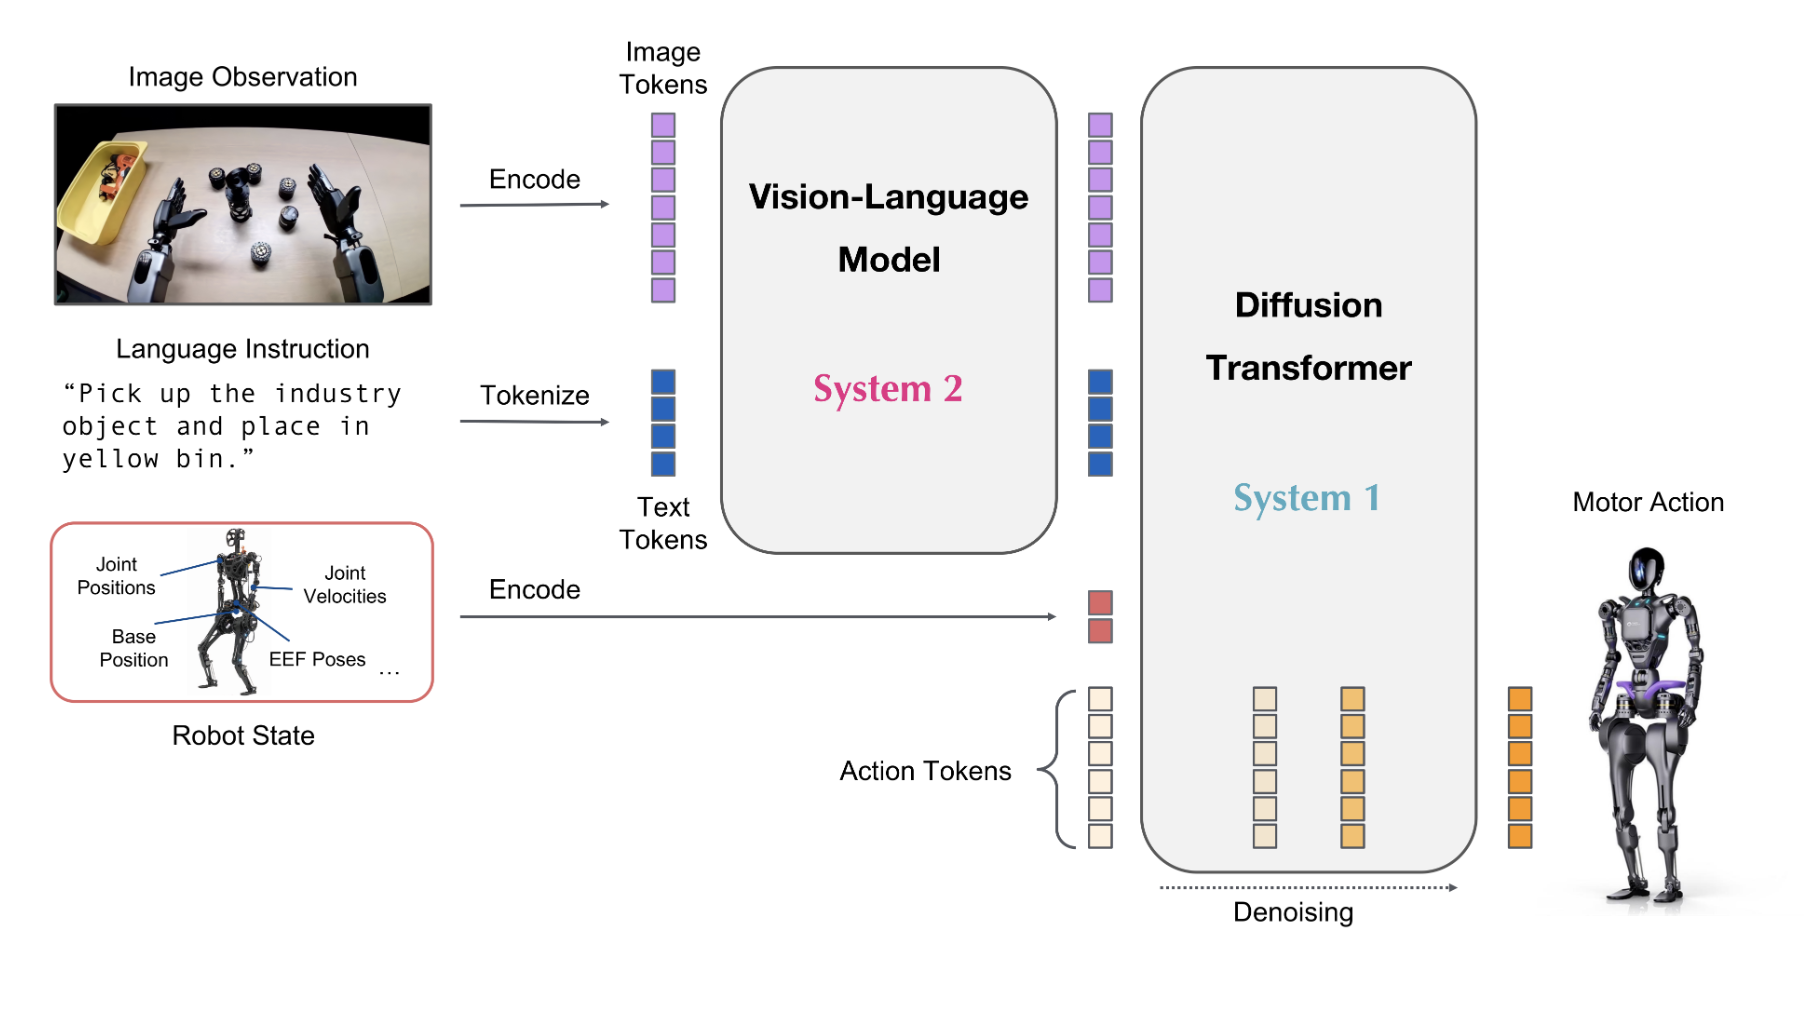
The conditioning tokens are extracted using a register_forward_hook on the final layer of the System 2 transformer before its output is consumed by System 1’s cross-attention. 
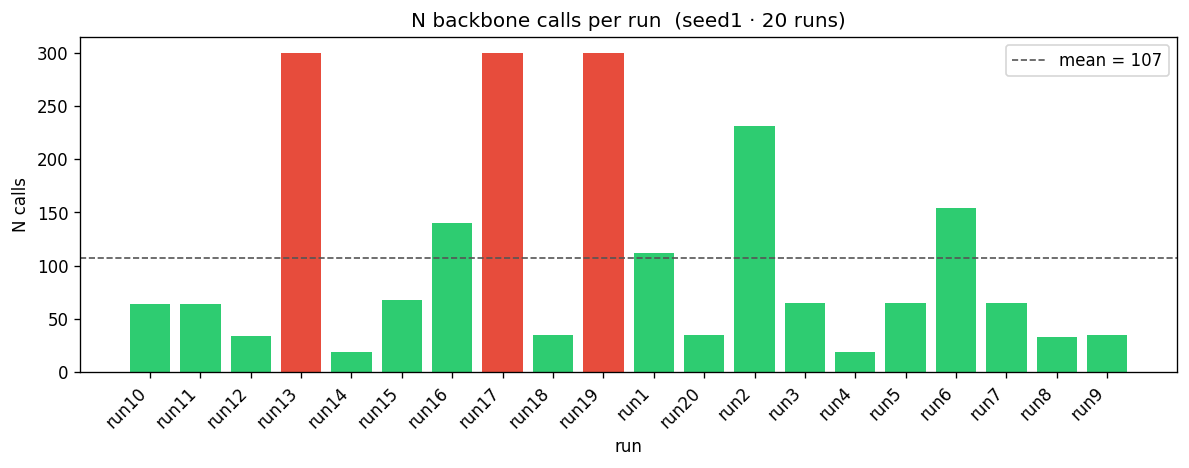
Each rollout step produces one embedding vector.

We collect embeddings across:

  • 4 tasks — Pick Coke Can, Close Drawer, Open Drawer, Move Near
  • Scene variants — SimplerEnv provides per-task visual variants (object placement, background, lighting)
  • N steps per episode — sampled uniformly per rollout

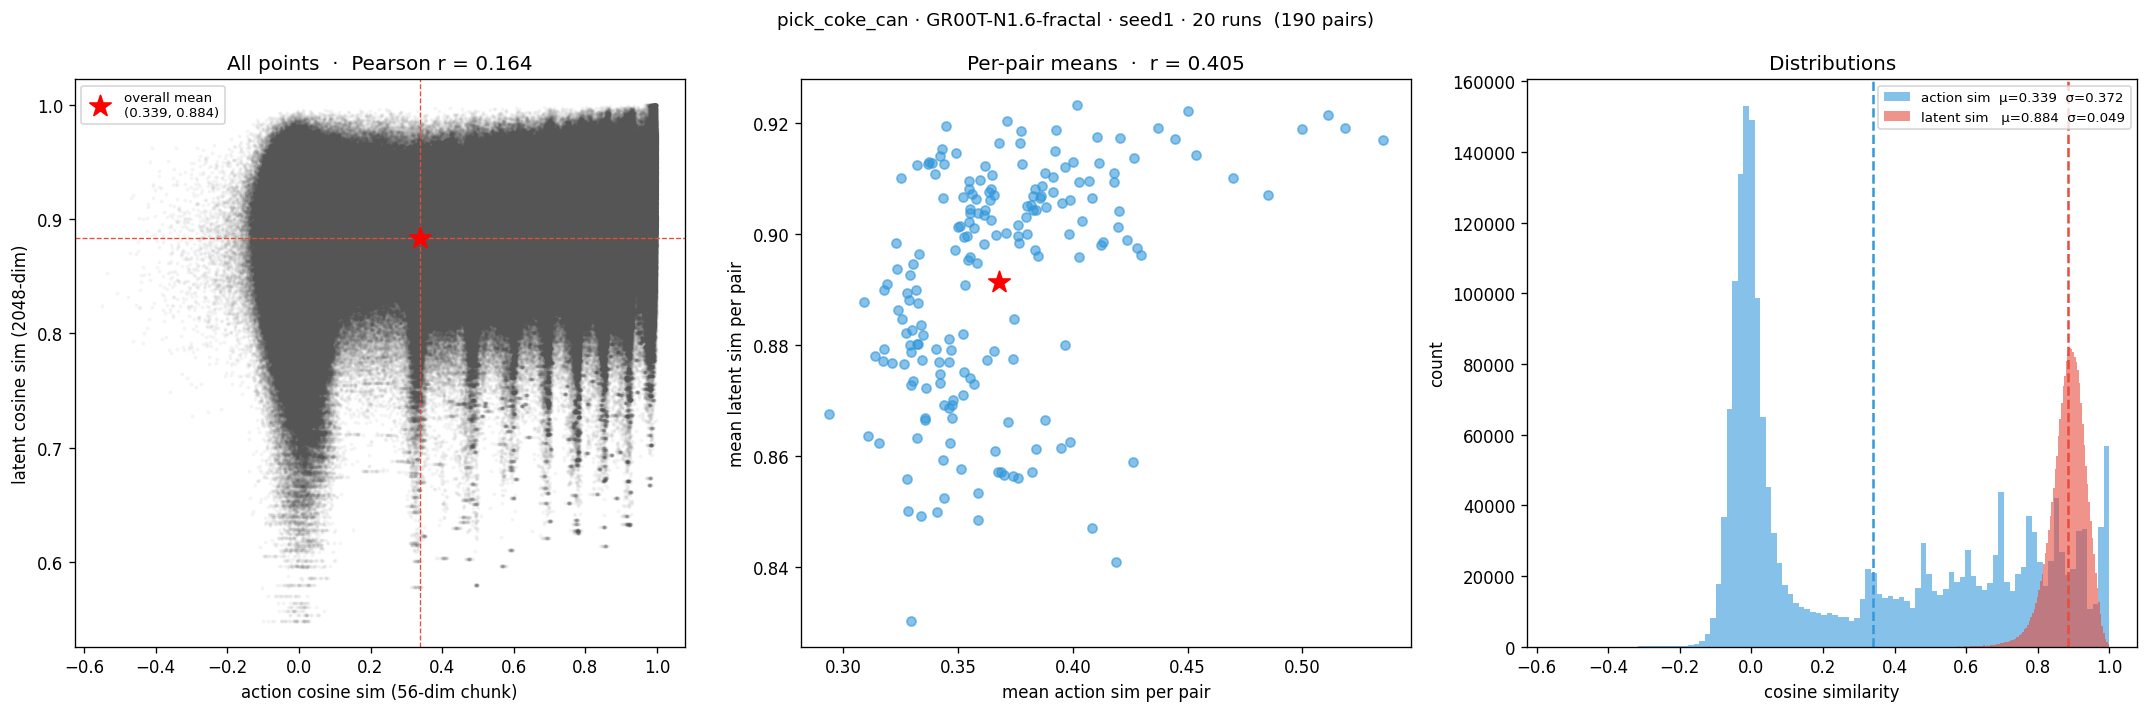
Each embedding is labeled with its task and scene variant. Analysis then asks: which label dominates the latent geometry?

Hypotheses

H1 — Task clustering (expected)

The conditioning tokens cluster by task regardless of scene variant. Same-task embeddings drawn from different scene variants are closer to each other than different-task embeddings drawn from the same scene. The interface encodes what to do; language conditioning is geometrically active in the bottleneck.

H2 — Scene clustering (alternative)

The conditioning tokens cluster by visual scene. Scene identity dominates the interface embedding over task semantics. The model encodes where you are rather than what to do, and task structure is absent or weak in the bottleneck.

Why fractal? nvidia/GR00T-N1.6-fractal generalizes across scene variants in SimplerEnv (Experiment 1), so it is the right model to probe: any task-clustered geometry we find is a genuine property of the learned bottleneck, not an artifact of a model that fails everywhere.

Setup

ComponentDetail
SimulationSimplerEnv (MuJoCo, headless via EGL)
RobotGoogle Robot (OXE_GOOGLE embodiment)
Modelnvidia/GR00T-N1.6-fractal — fine-tuned on OXE Fractal
Task (current)Pick Coke Can — multi-task coming next
Action chunkingac1 — 1 action executed per backbone call, 8 predicted
Hook pointS2 → S1 conditioning output, every backbone call
HardwareAWS g5.2xlarge — NVIDIA A10G 24 GB, 32 GB RAM

Data Structure

Each episode saves one .npz file alongside its video. The two key arrays per file:

backbone_features
(N_calls, 1, 107, 2048)  float32

The S2 → S1 conditioning output at every backbone call. 107 tokens — vision patch tokens + language tokens concatenated. 2048 — embedding dimension. One row per backbone invocation during the episode.

actions_action.{x,y,z,roll,pitch,yaw,gripper}
(N_calls, 1, 8, 1)  float32  × 7

The action chunk decoded by System 1 at each backbone call. 8 steps predicted per call; only step 0 is executed (ac1). 7 DOFs — Cartesian EEF (x, y, z, roll, pitch, yaw) + gripper.

For analysis we flatten each action chunk to a 56-dim vector (8 × 7 DOFs) and mean-pool the backbone tokens to a 2048-dim vector. Both are L2-normalised before computing cosine similarity.

Current Data

All runs are on Pick Coke Can with nvidia/GR00T-N1.6-fractal. Two seeds — same environment initialisation within each seed, independent rollouts across runs.

SeedRunsSuccessN calls rangeNotes
seed42 3 3 / 3 34 – 190 Initial exploration — no action data
seed42 3 3 / 3 34 – 190 Re-run with action chunks saved
seed1 20 17 / 3 19 – 300 Main batch — backbone features + action chunks

Preliminary Exploration

Single-task (Pick Coke Can), single-seed (seed1), 20 runs. These plots probe the relationship between action outputs and backbone representations before scaling to multiple tasks.

Episode length variability

Number of backbone calls per run. Each call = one observation processed, one 8-step action chunk output, one action executed. Failures hit the 300-call episode limit. Successful episodes vary from 19 to 231 calls — the model finds the object at very different speeds despite the same seed.

Action similarity vs Latent similarity

For every pair of runs we compute the full NA × NB cosine similarity matrix in both action space (56-dim chunk) and latent space (2048-dim mean-pooled backbone). The left scatter plots every individual call-pair; the right histogram shows how spread out each space is.

The key observation: action similarity spans nearly the full range (−0.55 – 1.0, σ = 0.37) while latent similarity stays tightly clustered (0.55 – 1.0, σ = 0.049). Pearson r between the two is 0.16 — the backbone produces near-identical representations regardless of the action chunk output.

Next: collect the same data across all 4 tasks and multiple scene variants, then run UMAP on the backbone representations coloured by task vs scene to answer H1 vs H2.